Adding Points of Interest and displaying them in Leaflet
Jun 16, 2016 • Guillermo Amat

In a previous previous post we wrote about Leaflet and how to show our maps in it. Now, we will see another interesting feature of Osiris that is the use of Points of Interest. Before that, we should explain what is a POI for us. In Osiris, POIs are called Features and are used to report about interesting services or places, being usually (but not necessary) outdoors. For instance, metro stations, bus stops, restaurants, etc. can be included as a POIs in our application.
Inserting a POI
Technically, a [Feature][api-doc] includes its coordinates and some more data we want to store as properties. Even more, Features have a geometry but we usually represent them as a simple point. So, if we want to include a bus stop in our map we can build a query like this:
{ "geometryDTO": {"type": "point", "latitude": 39.494143264768105, "longitude": -0.40192766277868941 }, "properties": {"name": "Bus stop", "type": "Transport", "subtype": "Bus", "description": "Bus stop. Lines 62, 63 and N3"}}The main concepts here are geometryDTO and properties. The first determines the type of geometry of the feature (a point in this case) and the geographic location of the POI. As this feature is a point, the representation will be only its coordinates. Secondly, the properties field is a container of data. For our POIs we want to store a name, its type and subtype and a description. Anyway, it is possible to store any other combination of keys an values, it just depends on the application design.
Now we want to send this information to our Osiris instance. To do that we use the previous JSON string in a CURL petition to the territory/feature method:
curl -i -H "api_key: valenciaconference" -H "Content-Type: application/json" -H "Authorization: Basic ZGVmYXVsdHVzZXI6bXlwYXNzd29yZA==" -X POST -d '{ "geometryDTO": {"type": "point", "latitude": 39.494143264768105, "longitude": -0.40192766277868941 }, "properties": {"name": "Bus stop", "type": "Transport", "subtype": "Bus", "description": "Bus stop. Lines 62, 63 and N3"}}' http://localhost:8020/osiris/geolocation/territory/featureFor these examples we are using the user “defaultuser” having “mypassword” as password. The base64 encoding of “defaultuser:mypassword” is “ZGVmYXVsdHVzZXI6bXlwYXNzd29yZA==”. This authentication string has to be included as a header parameter (Authorization) on every call to Osisris’ methods.
In order to check we have inserted anything, we can do a generic search like this:
curl -i -H "api_key: valenciaconference" -H "Content-Type: application/json" -H "Authorization: Basic ZGVmYXVsdHVzZXI6bXlwYXNzd29yZA==" -X POST -d '{}' http://localhost:8020/osiris/geolocation/territory/search?layer=FEATURESAnd Osiris will return this JSON
[{"properties":{"name":"Bus stop","type":"Transport","subtype":"Bus","description":"Bus stop. Lines 62, 63 and N3"},"propertiesRelations":[],"id":"5762b9482b1803ea835b53d4","geometryDTO":{"type":"point","latitude":39.494143264768105,"longitude":-0.4019276627786894}}]Including the POIs in our map
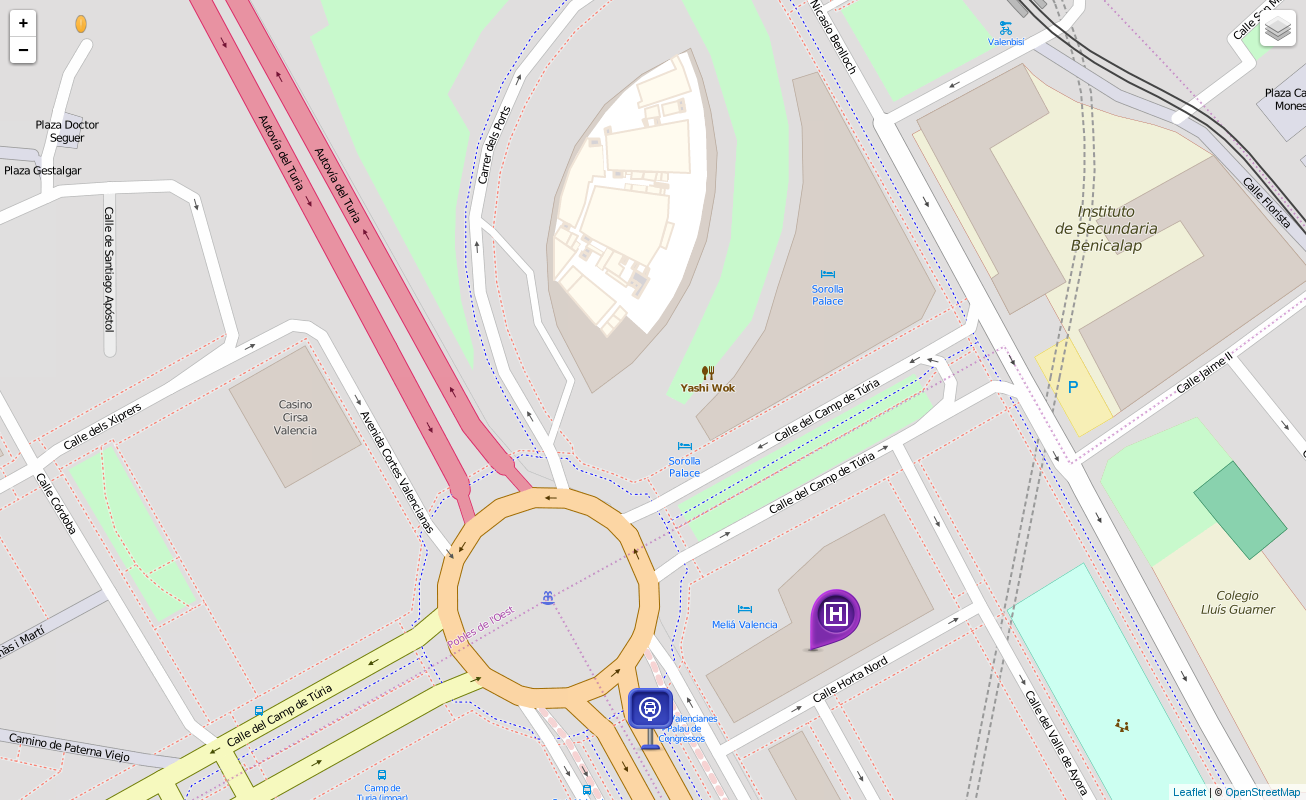
In our example, we will use type and subtype values to get an icon, using the format type-subtype.png (i.e transport-bus.png). In addition, we will create a PopUp for our Marker assigning the description data to it.
Having the POI inserted in our database, we wan to show it on our map. We will modify slightly our queryMap function written in the previous tutorial to search in both MAP and FEATURES collections. The only thing we need is to add a parameter to get the layer value for the search.
/**
 * Performs an AJAX call using JQuery
 **/
function queryMap(api_key, authorization, layer, query, callbackFunc){
    $.ajax({
        url:"http://localhost:8020/osiris/geolocation/territory/search?layer="+layer+"&pageSize=1000",   // Osiris server URL
        type:"POST",
        headers:  {"api_key" : api_key, 'Authorization': 'Basic '+authorization },
        data: query,
        dataType: "json",
        contentType: 'application/json',
        success: callbackFunc,
        error:function(jqXHR,textStatus,errorThrown)
        {
            alert("There is an error: "+errorThrown );
        }
    });
}
Of course, the calls to that function in the index.html should include the new parameter:
 // Let's add the POIs
 queryMap(api_key,authorization,"FEATURES","{}",drawPOIs);
Finally, we need a function to draw the markers using the JSON data obtained from Osiris.
/**
 * This function adds the POIs. It expects points with a description field in the properties
 **/
function drawPOIs(data){
    var pois = data// JSON.parse(data);
    for (i = 0; i < pois.length; i++){
        if (pois[i].hasOwnProperty("geometryDTO") && typeof(pois[i].properties) !== 'undefined'){
            if (typeof(pois[i].geometryDTO.type) !== 'undefined'){
                var lat=pois[i].geometryDTO.latitude;
                var long=pois[i].geometryDTO.longitude;
                var iconName = ("img/"+pois[i].properties.type+"-"+pois[i].properties.subtype+".png").toLowerCase()
                var myIcon = L.icon({iconUrl: iconName,iconSize: [64, 64]});
                L.marker([lat,long],{icon: myIcon}).addTo(mymap).bindPopup(pois[i].properties.description).openPopup();
            }
        }
    }
}
The source code of this tutorial can be found in our examples repository at GitHub


